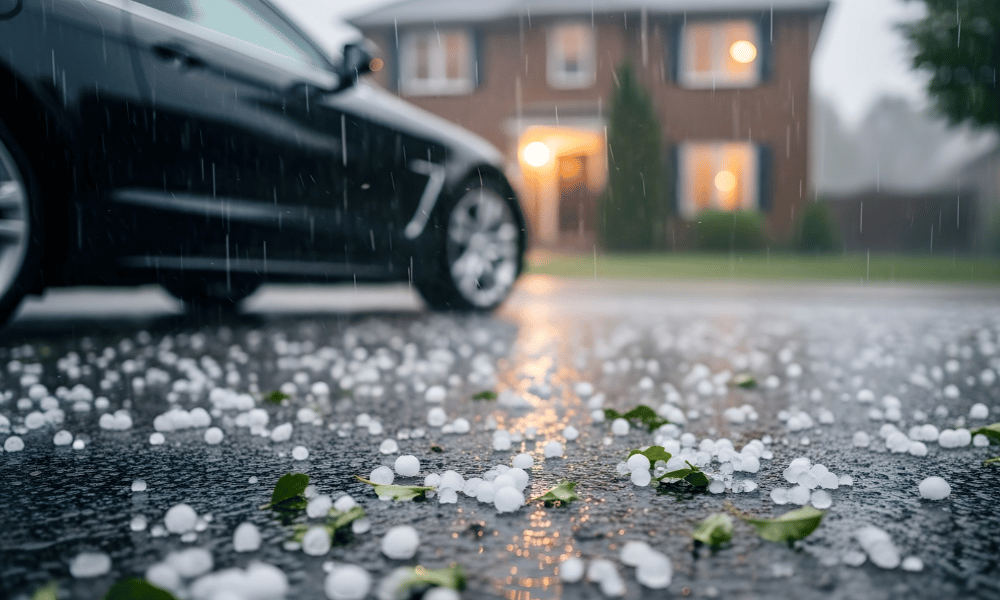
The insurance industry loss from the severe convective storms (SCS) that struck Australia’s east coast between October 26 and November 1, 2025, has been finalised at AU$1,620 million.
Catastrophe data provider PERILS (Property Exposure and Reference Information Loss System), the independent Zurich-based organisation providing industry-wide catastrophe insurance data, released the fourth and final estimate on November 2, 2026. The figure is based on loss data collected from the majority of the Australian insurance market.
The final number is 8% higher than the third estimate of AU$1,501 million, published on April 30, 2026. Property losses accounted for 87% of the total, while motor losses made up the remaining 13%. Queensland bore 94% of the industry loss, followed by New South Wales at 4.5% and Victoria at 1.5%.
Read more: PERILS lifts October east coast storm loss to $1.512 billion
Darryl Pidcock, head of Asia Pacific and cyber at PERILS in Zurich, commented: “As Australia experiences the peak storm season, this event is a reminder of the widespread damage that severe convective storms can cause, especially along the east coast of Australia. We continue to observe various factors driving industry losses such as an increase in vulnerable assets, especially with the growth of solar panel installations in Australia, and the impact of a warming climate. Australia is currently experiencing El Niño conditions which typically bring drier and hotter conditions to eastern Australia. Notwithstanding, the threat of convective storm activity is still very real as recent storm and flash flooding activity reminds us, especially during spring into early summer.”
That exposure is growing. As of December 31, 2025, Australia had approximately 4.3 million rooftop solar installations with a combined capacity of 28.3 GW, according to the Clean Energy Council. Queensland, where 94% of the storm losses were concentrated, accounted for about 1.16 million of those installations, the highest count of any state.
For brokers advising commercial and residential clients in regions with concentrated catastrophe exposure, these numbers point to a widening gap between insured asset values and existing coverage assumptions, particularly where rooftop solar adds hail-vulnerable infrastructure that standard property policies may not fully account for.
Pidcock continued: “We have observed more modest loss development in the last six months as insurers settled claims, with an 8% increase since our previous loss report, which is within expectations for this type of event. We would like to thank our insurance partners for their continued support providing timely and quality data.”
Eastern Australia experienced repeated outbreaks of severe thunderstorms over the week-long event window, driven by prolonged atmospheric instability.
The most significant episode struck the greater Brisbane region in South East Queensland on October 26. A tornado also caused damage in Melbourne’s western suburbs on the same day. After a brief lull, another round of storms hit South East Queensland and parts of northern New South Wales on October 31 to November 1.
The Bureau of Meteorology (BoM) had flagged the east coast, particularly northern New South Wales and southern Queensland, as carrying the highest thunderstorm risk during the October-to-December window in its severe weather season outlook, issued on October 15, 2025.
Read more: Hail havoc: 2025 extreme weather losses jump 700% to $4.8 billion
The fourth PERILS report breaks down property and motor losses by postcode using high-resolution CRESTA Zones, a standardised geographic grid system used across the insurance industry for catastrophe risk aggregation, with data split between residential and commercial lines.
It also includes physical intensity data on maximum hail size. Insurers and reinsurers can use these metrics to assess risk damageability and validate vulnerability functions in probabilistic catastrophe models, as hail-driven extreme weather losses rose sharply across Australia in 2025.
The late October event was one of several catastrophes that pushed total insured losses from declared extreme weather events in 2025 to approximately $4.8 billion, according to the Insurance Council of Australia (ICA). That represents a 727% increase on 2024, with Queensland accounting for more than $4.1 billion.
The ICA reported that insurers handled roughly 294,000 claims from declared events during the year, almost six times the prior year’s total. The average cost per claim rose 39% to $16,471.
Brokers with clients in storm-prone corridors along the east coast may want to revisit how earlier loss estimates for these storms evolved over 12 months when preparing for renewal conversations, given the sustained upward trajectory in both claim frequency and severity.
The final loss data is available through the PERILS Industry Exposure & Loss Database. PERILS loss estimates can serve as triggers in insurance risk transactions such as industry loss warranty contracts and insurance-linked securities.