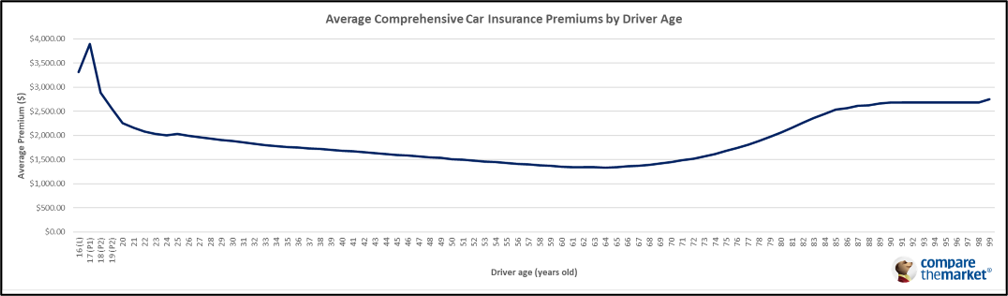
New data from comparison platform Compare the Market has quantified a premium gap that runs to more than $2,500 across the age spectrum of Australian drivers: a 17-year-old P1 licence holder pays an average comprehensive car insurance premium of $3,897, while a 64-year-old at the curve’s trough pays $1,332. The research arrives as average Australian motor premiums have risen 42% since 2019 and as independent road safety research increasingly questions one of the structural assumptions underpinning how the older end of that curve is priced.
Compare the Market analysed quotes from eight comprehensive car insurance providers for example drivers aged 16 to 99, using a consistent profile – a female driver in Alderley, Brisbane, insuring a 2026 Toyota Corolla Ascent Sport Hybrid hatchback on May 21, 2026, with no claims history and a $900 excess. The resulting premium curve is U-shaped. Costs fall from a peak at age 17 through to a trough at age 64, then rise steadily, accelerating at 4% to 5% annually through a driver’s 70s and early 80s, before stabilising at $2,683 between ages 91 and 98. The research also found a $1,219 spread in quoted premiums across the eight insurers for a single 17-year-old profile – evidence of materially different risk appetites in the market for high-risk cohort segments and a figure with direct implications for broker placement decisions.
Compare the Market economic director David Koch attributed the pricing structure to historical claims data. “They say the best predictor of the future is the past, and basically every time someone makes a claim it adds to the tapestry of data insurers use to calculate future risk. Young drivers starting out on their provisional licence are less experienced on the roads and statistically much more likely to be in a serious crash. The higher the risk of an accident, the higher the premium,” Koch said.
Read next: The man who built a career on small bets is placing a big one on Santa Monica
The premium curve’s shape tracks national fatality statistics. According to the National Road Safety Data Hub, per capita road death rates are consistently highest for the 17-25 age group at 7.6 per 100,000 population and for those aged 75 and over at 7.5 per 100,000 – the same two cohorts that mark the premium curve’s peaks. In 2024, there were 1,300 road crash deaths in Australia, a 3.3% increase from 2023, continuing an upward trend of approximately 4% per year since 2020.
For older drivers, state licensing frameworks impose escalating medical assessment requirements intended to act as a risk filter. In New South Wales, drivers aged 75 and over must pass an annual medical assessment to retain their licence, and those with an unrestricted Class C licence from age 85 must also pass an on-road driving assessment every two years. In Queensland, drivers aged 75 and over must obtain an annual medical fitness certificate from their GP and are required to carry that certificate while driving. Victoria imposes no age-based assessment requirement, requiring only that drivers self-report conditions affecting their fitness to drive.
Whether that jurisdictional variation produces a measurable difference in crash risk is contested. Dr Matthew Baldock, deputy director of the Centre for Automotive Safety Research at the University of Adelaide, said evidence did not support the premise that mandatory assessments reduced road risk among older drivers. “In Victoria, there’s no mandatory age-based assessments for older drivers and Victorian older-driver crash rates are certainly no higher than anywhere else in Australia,” Baldock said, according to National Seniors Australia. Baldock noted that research indicated older drivers have the lowest crash rate of any age group per licensed driver – a figure partly explained by reduced driving frequency – and that mandatory medical or practical assessments did not appear to translate to safer roads.
For insurers pricing the over-65 cohort nationally, Baldock’s finding raises a question with direct underwriting relevance: if the jurisdictional licensing variable does not measurably reduce claims incidence, then the risk loadings applied to older drivers across all states may be grounded primarily in age-as-proxy rather than demonstrably higher risk per kilometre driven.
Read next: WA road deaths set to top 200 for first time since 2008
The premium data does not sit in isolation. In March 2025, Insurance Council of Australia (ICA) CEO Andrew Hall stated that a “42 per cent increase in premiums over five years reflects the costs that insurers are managing but is unsustainable for Australian motorists,” calling for targeted government reforms to address systemic cost drivers outside the industry’s direct control. The ICA’s Motor Insurance Policy Paper found repair costs had climbed 26% since 2022, driven by rising wages, more expensive parts, and increasing vehicle complexity, with repair bills now comprising approximately 60% of claims costs.
Canstar’s 2025 analysis found that drivers aged 50 and over recorded the steepest premium increases of any age group, with costs rising 6.51% on average against a market-wide increase of 5.8%. That dynamic, layered on top of the structural 4% to 5% annual loading that the Compare the Market data shows beginning at age 65, means the older-driver cohort is absorbing compounding pressure from both risk-based age loading and broad inflationary claims trends simultaneously.
Dr Fei Huang has separately noted that non-risk-based pricing factors – including behavioural signals such as the likelihood of switching providers – can disproportionately affect older Australians, raising the question of whether behavioural pricing mechanisms may further compound the impact of structural age loadings on this cohort.