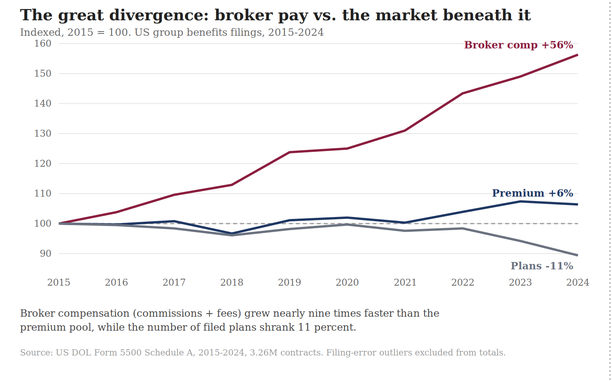
Disclosed broker compensation in federal employee benefit filings rose 56 percent between 2015 and 2024 - roughly eight to nine times faster than the insured premium pool from which it is drawn - according to a decade-long analysis of US Department of Labor (DOL) Form 5500 Schedule A filings covering 3.26 million insurance contracts.
Over the same period, total insured group premiums reported in those filings grew from $33.7 billion to $35.9 billion, an increase of approximately six percent. The number of benefit plans in the dataset fell from 122,175 to 109,251. The market grew slowly and served fewer plans at the end of the decade than at the start.
The Insurance Business Benefits US analysis found that broker compensation did not follow that trajectory. Total disclosed compensation (commissions plus fees reported on Schedule A) rose from $5.5 billion in 2015 to $8.6 billion in 2024.
Commissions grew 46 percent, from $4.45 billion to approximately $6.5 billion. Fee income nearly doubled, climbing from $1.1 billion to $2.1 billion and rising from approximately 19 percent of total broker pay to about 25 percent over the decade.
Read next: Report: The quiet death of the commission model
Measured per plan, the divergence is sharper still. The average filed plan generated roughly $45,000 in broker compensation in 2015 and nearly $79,000 by 2024 - a 75 percent increase - against premium growth per plan that was a small fraction of that figure.
Even on a per-covered-life basis, where the picture improves somewhat because covered lives grew from 119 million to 130 million as plans consolidated into larger pools, broker compensation still rose approximately 43 percent: roughly seven times the growth in premium per person.
The benefits brokerage community's most commonly cited explanation is that the scope of the job has fundamentally expanded. Compliance oversight, benefits technology selection, employee communications, and pharmacy benefit audits are now standard components of the broker relationship in ways they were not in 2015, and the near-doubling of fee income over the decade is broadly consistent with that shift from transactional commission to advisory retainer.
Joshua Levine, chief executive officer of Capitol Benefits in Washington, DC, endorses that explanation, while adding a layer of specificity the data alone cannot capture.
"Two things are driving it," Levine said. "First, compliance and regulatory requirements have grown enormously over this decade, and brokers have absorbed much of that work and its cost. Services employers used to pay accountants and attorneys for are now handled by their broker and covered by the broker's compensation instead of a separate invoice. So part of that gap is not new cost at all - it is the same work, moved to a different line on the invoice."
Levine pointed to Affordable Care Act (ACA) reporting, RxDC reporting requirements, and new state paid leave programs such as Maryland's Family and Medical Leave Insurance (FAMLI) as concrete examples of work that has migrated to brokers since 2015.
"Either way, clients should read fee growth as a reflection of added work," he said, "and they should ask their broker exactly what they are getting for it."
The second structural explanation centers on plan consolidation. The decade's falling plan count is partly a story of employers moving into professional employer organizations (PEOs), trusts, and multi-employer arrangements - vehicles that are themselves heavily brokered.
The largest broker payers in the dataset are not individual corporations but aggregators of exactly this kind: ADP TotalSource alone paid brokers approximately $224 million over the decade.
The filings reveal significant variation by employer size. Broker compensation represents approximately 45 percent of premium at the smallest employers versus 13 percent at the largest, and roughly 43 percent in fragmented industries such as mining versus 12 percent in utilities. That pattern - compensation tracking a buyer's size and sophistication more closely than the scope of services rendered - is increasingly visible to regulators and corporate benefits committees.
Levine acknowledged the disparity but attributed it to service economics rather than pricing power. "A five-person group needs the same enrollment support, compliance guidance, and renewal work as a much larger one," he said. "The cost of doing the work does not shrink with the size of the group."
He noted that compensation structures for small employers have largely shifted from percentage-of-premium models to flat per-employee-per-month (PEPM) arrangements, partly for this reason: "Before that shift, a five-employee group could generate less than $100 a month in total commission, which meant we were losing money servicing it."
The data has limits worth stating plainly. Form 5500 Schedule A covers only insured arrangements, meaning a broker who shifted clients toward self-funded plans over the decade would show reduced disclosed compensation even if total revenue held steady or grew. The true growth in broker economics may therefore be understated rather than overstated.
Disclosure rules also tightened mid-decade under the 2021 Consolidated Appropriations Act (CAA), which likely accounts for some portion - though probably not most - of the reported fee growth.
None of that changes the core comparison. Reported broker compensation grew roughly nine times faster than the premium pool it is drawn from, over a decade in which the number of paying employer clients fell by more than 10 percent.
Critically, the figures come from filings employers themselves submit to federal regulators. Under the CAA, those same employers now have a clearer fiduciary basis for scrutinizing broker compensation disclosures.
Levine said that shift in client awareness is already visible in practice - and that Capitol Benefits is prepared for it. "The CAA has made compensation conversations more direct, and we welcome that. We are comfortable with the scrutiny because we know what we deliver, and our 99 percent client retention tells us our clients agree." He added that the firm's book of business has grown 112 percent organically over the past two years, without raising commission rates on existing clients.
For the broader brokerage channel, the message from this data may be that the brokers who can articulate what the last decade's compensation growth bought their clients are well positioned heading into the next round of employer renewals. The ones who cannot should expect to be asked.
Methodology: All figures from US Department of Labor Form 5500 Schedule A filings, plan years 2015–2024, covering 3.26 million insurance contracts. Sixty-five contract-level records with outlier-scale dollar values - including a single filing reporting $9.7 trillion in commissions - were flagged and excluded from totals; the raw filings are preserved and documented in an accompanying accuracy audit. Per-plan and per-life figures are computed on outlier-cleaned sums. Figures reflect insured arrangements only.