For decades, the question of which firm truly dominates American benefits brokerage has been answered with marketing.
League tables built from self-reported revenue. Rankings that mix property-casualty with benefits. Surveys that count whoever answered the phone. The federal government, it turns out, has been keeping score the whole time.
Every year, employers sponsoring large benefit plans must tell the US Department of Labor (DOL) exactly which brokers they paid and how much; a legally required disclosure buried in a filing called Form 5500, Schedule A.
Insurance Business assembled 10 years of those filings amounting to 4.3 million individual broker payment records from 2015 through 2024; normalized more than a quarter-million broker name spellings, stripped out a handful of typo-scale filing errors, and added it all up.
The result is the first independently verified ranking of America's benefits brokers by disclosed compensation. And it is a photo finish.
Gallagher Benefit Services takes the crown with $2.96 billion in disclosed compensation. Mercer Health and Benefits follows at $2.84 billion. Lockton Companies sits third at $2.76 billion.
Three firms, 10 years, separated by roughly seven percent, with Marsh McLennan Agency ($2.23 billion) and USI Insurance Services ($1.78 billion) rounding out the top five.
But the decade total hides the better story: the annual lead has changed hands three times.
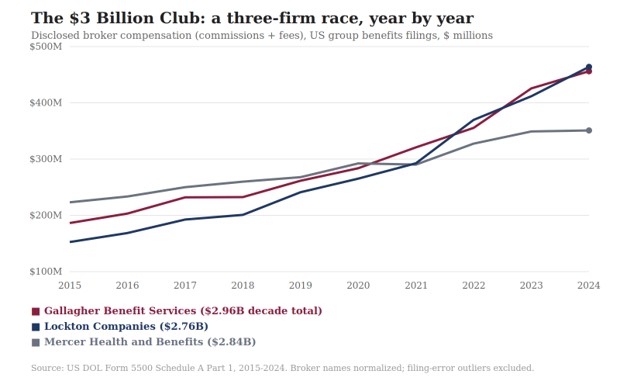
Break the period into years and three distinct eras emerge. From 2015 through 2020, Mercer led every single year with the consulting giant opening the decade at $223 million in annual disclosed compensation while Gallagher managed $186 million and Lockton just $153 million. Mercer's crown looked permanent. Then it stopped growing.
Since 2021, Mercer's annual figure has moved from $290 million to $351 million which is respectable by any measure, but modest against what happened around it. Gallagher, powered by its relentless acquisition machine, took the annual lead in 2021. And privately held Lockton, with no shareholders to please and no integration cycles slowing it down, simply accelerated. The firm tripled its annual disclosed compensation over the ten years, from $153 million to $464 million.
Lockton finished the final year of the analysis as America's top benefits broker by disclosed compensation with $463.9 million versus Gallagher's $456.2 million. It had already stolen the annual crown once before, in 2022, before Gallagher snatched it back. The crown belongs to Gallagher; the trajectory belongs to Lockton.
"The real advantage of independence is who you answer to," said Joshua Levine, CEO of Capitol Benefits, an independent brokerage in Washington, D.C. "When there are no outside investors waiting on a return, every decision can be about your clients and your team, and you can play the long game with both."
There is a second race hiding in the data, and it reveals two competing theories about how to win the US benefits market.
USI Insurance Services appears on more filings than any rival; more than 40,065 over the 10 years from 2015 to 2024, thousands ahead of any competitor, while earning approximately 60 percent of Gallagher's total disclosed compensation. USI wins by being everywhere. Lockton and Mercer win by being expensive. Gallagher, characteristically, does both.
John Meister, executive vice president at Newfront in Southern California, whose firm was acquired by Willis Towers Watson, sees consolidation reshaping both strategies from the ground up. "There's just been a consolidation in the brokerage world," Meister told Insurance Business. "We got bought by Willis Towers Watson. Aon just bought USI." He added that regardless of scale, the human relationship at the center of brokerage is not going anywhere: "No matter how much AI comes in and technology comes in, there's still this baseline relationship that clients have to have with their broker. I don't know how you're gonna replace that ever."
Alan Whitman, chief executive officer of Nichols Cauley in Atlanta, Georgia, frames acquisition strategy through a dual lens of geography and capability, having recently added benefits firm LaRocco to a platform originally built around property-casualty and accounting. "As we look at acquisitions, we look through two lenses - geographic markets and capabilities," Whitman told Insurance Business. "LaRocco was a quintessential capability play, because benefits costs are skyrocketing every year."
In a market where the underlying premium pool grew just six percent over ten years, the three firms found a way to roughly double (and in Lockton's case triple) their disclosed compensation. The intermediary layer grew dramatically faster than the market it serves.
Kara Hoogensen, senior vice president of Benefits and Protection at Principal Financial Group in Des Moines, Iowa, sees the expansion of broker responsibilities as a key driver.
"HR departments are generally speaking shrinking," Hoogensen told Insurance Business. "That doesn't mean the work is going away. Someone else is just potentially doing that, or there are fewer people charged with doing more. What we're seeing is a higher degree of dependence on the broker; not only for subject matter expertise, but for fresh ideas, technology solutions, and driving efficiencies."
Meister frames the same trend from the broker's perspective, noting how the scope of work has expanded well beyond what compensation structures were designed to cover.
"Pre-Affordable Care Act, as a broker you would just manage medical, dental, life, disability," he said. "Once the Affordable Care Act (ACA) came into force, it was the beginning of just the sheer quantity of things that brokers are managing where, frankly from a business standpoint, you don't get paid on. The portfolio keeps expanding. And yet there's this interesting thing where you get paid off the medical and traditional insurances, but you're managing and most of your time is almost being spent in these other things."
Levine made the strategic implication explicit. "The volume model depends on transactional work, and that is exactly the work AI is going to absorb,” he said. “Enrollment, renewal spreadsheets, and basic plan comparisons will get faster and cheaper. What technology will not replace is an advisor who knows your people, spots a problem before it hits your renewal, and sits across the table from you when something goes wrong."
For Levine’s Capitol Benefits, the more meaningful measure of a brokerage's position is not compensation volume at all. "Revenue tells you how big a firm is. It does not tell you whether clients are better off for working with you. The numbers we watch most closely are client retention and satisfaction."
The DOL filings that underpin this analysis are precise in their scope. Schedule A captures compensation disclosed on insured group benefit arrangements - commissions and fees tied to insurance contracts that employers report to federal regulators under the Employee Retirement Income Security Act (ERISA).
The data does not capture consulting revenue billed outside insurance arrangements, compensation on self-funded plans without insured components, or the property-casualty business that dominates some of these firms' overall revenue.
What the filings do provide - for the first time at this scale - is an apples-to-apples measure of who gets paid what in the insured benefits market, according to the employers doing the paying, under penalty of federal law.
In a market where the premium pool grew just six percent over ten years, that verification matters. Three firms found a way to roughly double, and one to triple, their take from it. How that happened - through acquisition, expanded scope, or genuine market share gain - is a question the same federal filings are already positioned to answer.
Methodology: Figures are total disclosed broker compensation (commissions plus fees) from US Department of Labor Form 5500 Schedule A Part 1 filings, plan years 2015–2024. Broker names normalized across 255,627 raw spellings. Nineteen records with typo-scale dollar values excluded from 4.33 million total. Rankings reflect filed names, not corporate-family rollups. Schedule A captures insured group benefit arrangements only and excludes self-funded plan compensation, standalone consulting fees, and property-casualty business.