The State Farm Carrier and Market Review shifts the focus to the state level, where performance is actually determined. Across auto and homeowners’ lines, the latest IB Industry Report maps how premium growth, competitive dynamics, and risk exposure diverge dramatically by jurisdiction – often in ways invisible or unexpected from carrier-aggregated and industry-wide data.
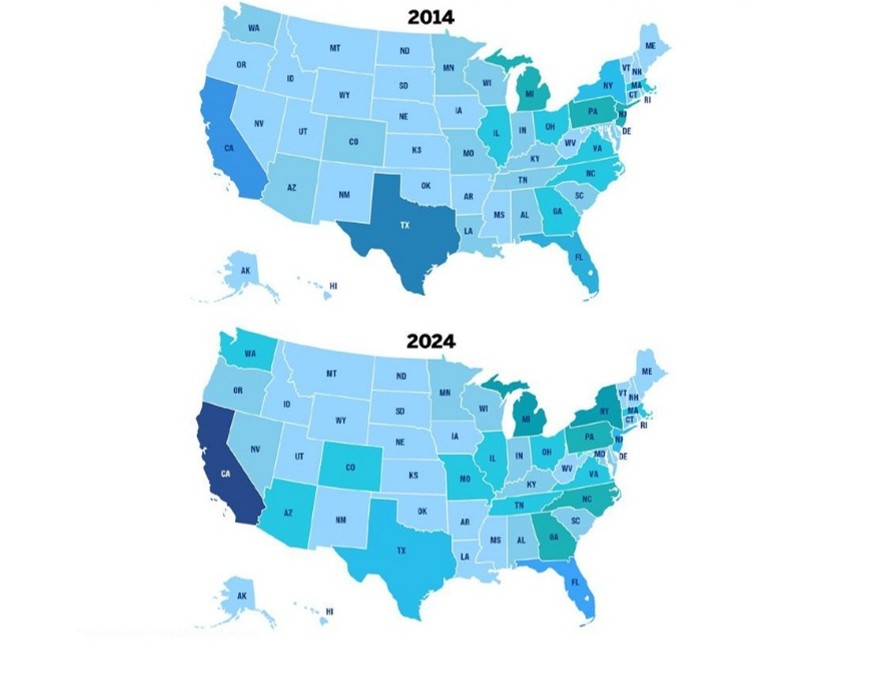
Between 2014 and 2024, State Farm’s private passenger auto premium in Texas and Florida alone increased by $2 billion each, while in those same states the rest of the market either contracted or grew at a significantly slower pace. Similar bets against the industry occurred in New York and Georgia. Yet this growth is not uniform. In homeowners’ multiple peril, State Farm doubled premium in two key states even as competitors exited those markets – but in Texas, it reduced homeowners exposure by nearly half while the broader market expanded sharply. The result is a geographically uneven but highly intentional footprint, where State Farm is simultaneously capturing share in core markets while selectively retreating or recalibrating in others.
The same states driving premium growth are often those carrying the greatest regulatory scrutiny, litigation activity, and catastrophe volatility. The report connects these threads, showing how geographic strategy is inseparable from underwriting risk and capital deployment.
For underwriters, brokers, and competitors, the implication is clear: CMP-style aggregation at the national level obscures the real drivers of performance. Portfolio decisions around pricing, placement, and appetite must be informed by jurisdiction-level intelligence.
The State Farm Carrier and Market Review deliver exactly that. Through detailed state-by-state premium mapping, peer comparisons, and longitudinal trend analysis, it provides a granular view of where growth is being achieved, where competitors are pulling back, and where risk is accumulating beneath the surface.
Combined with 29 figures, six analytical chapters, and a full data appendix for internal modelling, the dataset allows professionals to pressure-test their own geographic exposure to one of the industry’s largest carriers.
Access the full State Farm Carrier and Market Review to move beyond national averages, refine your state-level strategy, and align underwriting decisions with where the market is truly shifting.
Get the complete report here.