
6Insurance businesses |
3Still posting losses |
$15.1BAllstate EBIT swing |
−$6.7BCentene net earnings |
In the insurance business, a single catastrophic hurricane season or a mispriced book of policies can turn a profitable giant into a red-ink machine overnight. But what happens next - whether a company rights the ship or drifts into permanent underperformance - tells the deeper story of management quality, capital discipline, and whether someone at the top had the stomach to make hard decisions. The past five years of SEC filings from America's top market-cap insurance businesses reveal exactly that: a cohort of dramatic reversals, slow-burn deteriorations, and, in at least three cases, a stubborn refusal to turn the corner.
The data, drawn from annual 10-K filings covering fiscal years 2021 through 2025, paints an unambiguous picture. The insurance businesses that recovered shared a common trait: they raised prices aggressively and took the short-term earnings pain before the competition did. Those that remain in the red - Centene, Equitable Holdings, and Oscar Health - each represent a different failure mode: one structural, one cyclical, one existential.
No comeback story in this dataset is more dramatic than Allstate's. In fiscal 2022, the Northbrook, Illinois property-and-casualty giant posted an EBIT of negative $1.495 billion - a staggering loss driven by an historic combination of catastrophe claims, auto insurance loss ratios that spiraled as post-pandemic inflation hammered repair costs, and a book of homeowner policies written at pre-2020 rate assumptions. By 2025, that same EBIT line read positive $13.555 billion. The arithmetic of that swing - $15.050 billion in EBIT improvement across three years - is the single most dramatic turnaround in the peer group. Allstate's 2025 net margin of 15.2% now ranks among the strongest in large-cap property and casualty insurance.
The recovery did not happen overnight. In fiscal 2023, Allstate's EBIT had clawed back to just $31 million - barely breaking even - before accelerating to $6.161 billion in 2024 and then $13.555 billion in 2025. That staircase of recovery reflects the multi-year lag between rate increases, policy renewals, and ultimate loss emergence that characterizes P&C insurance cycles.
Cincinnati Financial's story is quieter but no less instructive. The Ohio insurance business posted a negative EBIT of $641 million in 2022 - the result of investment portfolio markdowns as the Federal Reserve raised rates sharply. Management did not panic. They waited, maintained underwriting discipline, and watched the investment portfolio recover. By 2025, EBIT reached $3.033 billion - a $3.674 billion swing from the 2022 trough. The EBIT margin hit 24.0% and net margin 18.9%, placing Cincinnati Financial among the most profitable names in the peer group.
Progressive's trajectory is equally compelling. In 2022, EBIT collapsed to $1.166 billion from $4.429 billion a year earlier - a direct result of catastrophic loss ratios in personal auto. By 2025, EBIT reached $14.501 billion and net earnings hit $11.308 billion, with a net margin of 12.9% on $87.637 billion in revenues. That is not merely a turnaround. That is a metamorphosis.
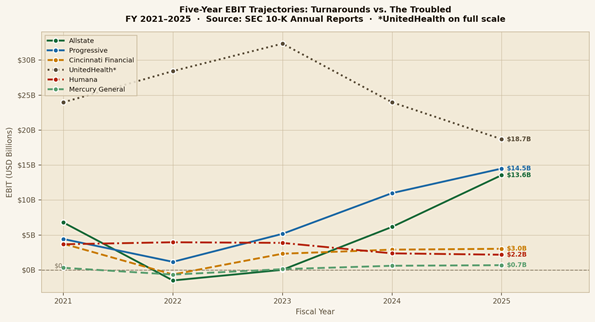
FIGURE 1 - Five-Year EBIT Trajectories: Turnarounds vs. The Troubled
Then there are the stories that didn't resolve neatly. Centene, the Medicaid-focused managed care giant with $194.777 billion in 2025 revenue, reported a net loss of $6.674 billion and an EBIT of negative $6.050 billion for fiscal 2025. What makes this particularly striking is the context: Centene was profitable in both 2023 (EBIT of $4.323 billion) and 2024 (EBIT of $4.959 billion). The 2025 loss represents a sharp, sudden reversal driven by Medicaid redeterminations and chronic mispricing in its ACA marketplace book.
Equitable Holdings presents a different failure mode. The company posted a net loss of $1.441 billion in 2025, with an EBIT of negative $969 million on $11.665 billion in revenues - a net margin of negative 12.4%. The company was profitable in both 2023 and 2024, and its 2025 EBIT of negative $969 million compares to positive $966 million just two years prior. This is a cyclical whipsaw, not a slow grind.
Oscar Health - the technology-forward individual insurance startup that listed publicly in 2021 - posted a net loss of $443 million in 2025 on $11.701 billion in revenues, a net margin of negative 3.8%. Oscar has not reported a profitable fiscal year in this five-year dataset. The net loss has narrowed from $606 million in 2022 and the company now operates at a scale where profitability is at least theoretically within reach.
FIGURE 2 - TURNAROUND TRACKER: FY2025 PROFITABILITY SCORECARD
|
Company |
FY2022 EBIT |
FY2025 EBIT |
EBIT Swing |
Net Margin |
Verdict |
|---|---|---|---|---|---|
|
Allstate |
−$1,495M |
+$13,555M |
+$15,050M |
15.2% |
Turned Around |
|
Progressive |
+$1,166M |
+$14,501M |
+$13,335M |
12.9% |
Turned Around |
|
Cincinnati Fin. |
−$641M |
+$3,033M |
+$3,674M |
18.9% |
Turned Around |
|
Markel Group |
+$44M |
+$2,939M |
+$2,894M |
13.1% |
Recovered |
|
Mercury General |
−$653M |
+$692M |
+$1,346M |
9.0% |
Recovered |
|
Hanover Insurance |
+$178M |
+$887M |
+$709M |
10.1% |
Recovered |
|
UnitedHealth |
+$28,435M |
+$18,699M |
−$9,736M |
2.7% |
Declining |
|
+$7,302M |
+$5,722M |
−$1,580M |
4.2% |
Softening |
|
|
Humana |
+$3,969M |
+$2,186M |
−$1,783M |
0.9% |
Under Pressure |
|
Centene |
+$2,627M |
−$6,050M |
−$8,677M |
−3.4% |
Fell Back |
|
Equitable Holdings |
+$3,193M |
−$969M |
−$4,162M |
−12.4% |
In the Red |
|
Oscar Health |
−$587M |
−$420M |
+$167M |
−3.8% |
Still in Red |
Not every story fits cleanly into "comeback" or "casualty." UnitedHealth Group occupies an uncomfortable middle category - a company that remains nominally profitable (net earnings of $12.056 billion in 2025, net margin 2.7%) but whose EBIT has declined sharply from a peak of $32.358 billion in fiscal 2023 to $18.699 billion in 2025 - a decline of $13.659 billion in just two years. The reasons are well-documented: Medicare Advantage reimbursement pressure from CMS, the prolonged aftermath of the Change Healthcare cyberattack, and actuarial stresses embedded in its care delivery model.
Humana sits in a more perilous position. The Louisville-based Medicare Advantage specialist earned $1.188 billion in net income on $129.664 billion in revenues in 2025 - a net margin of 0.9% and EBIT of $2.186 billion. Compare this to fiscal 2022, when Humana posted EBIT of $3.969 billion on a far smaller revenue base. The company is now generating less operating income in absolute dollars on a significantly larger book of business - the classic sign of a margin structure under structural pressure, not merely cyclical disruption.
MetLife tells the story of a slow, uncatastrophic drift. EBIT peaked at $9.438 billion in 2021 and had ground down to $5.722 billion by 2025. Net margin now sits at 4.2%. The trajectory is not alarming quarter-to-quarter but adds up to a material erosion over the full five years.
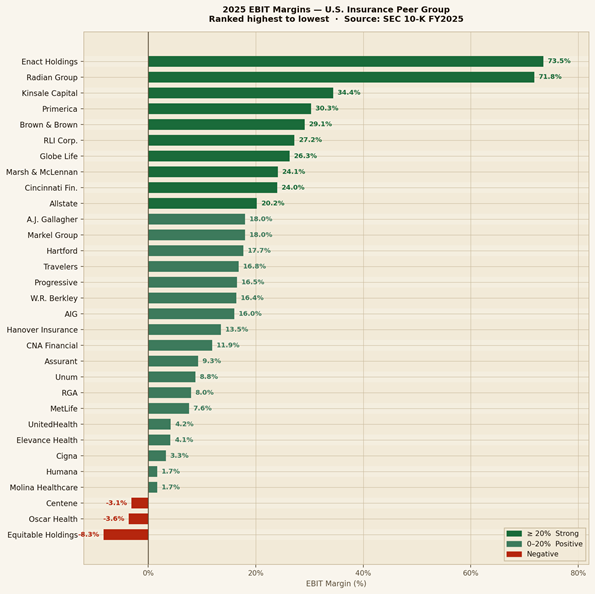
FIGURE 3 - 2025 EBIT Margins Across the US Insurance Peer Group
Ranked highest to lowest · EBIT ÷ Total Revenue
Across the turnarounds in this dataset, three common threads emerge. First, speed of price action. Allstate, Progressive, and Mercury General all raised rates faster and more aggressively than peers - taking the short-term policy attrition and earnings pain to reset their books at sustainable margins. Companies that hesitated paid with years of compounded underperformance.
Second, balance sheet clarity. Cincinnati Financial and Markel Group both recognized their 2022 losses cleanly and promptly, without reserve manipulation or accounting maneuvers. That transparency allowed management and investors to understand the true state of the business and plan accordingly. Clean books heal faster than obscured ones.
Third - and perhaps most underappreciated - reinsurance discipline. Companies like W.R. Berkley (FY2025 EBIT margin 16.4%, net margin 12.2%) and Kinsale Capital Group (EBIT margin 34.4%, net margin 26.9%) maintained consistently positive EBIT across the entire five-year window. They never let gross exposure outrun their reinsurance towers.
The turnaround cycle in American insurance is never truly over. The industry operates on a rhythm of pricing softness, loss emergence, repricing, and recovery that has repeated for generations. What changes is which companies are positioned to move fastest when the cycle turns - and which are still arguing internally about whether it has turned at all. In the five years captured by this dataset, that distinction has been worth tens of billions of dollars in earnings. The lesson is not complicated: price early, price honestly, and never confuse a favorable loss year for a permanent change in the risk environment.
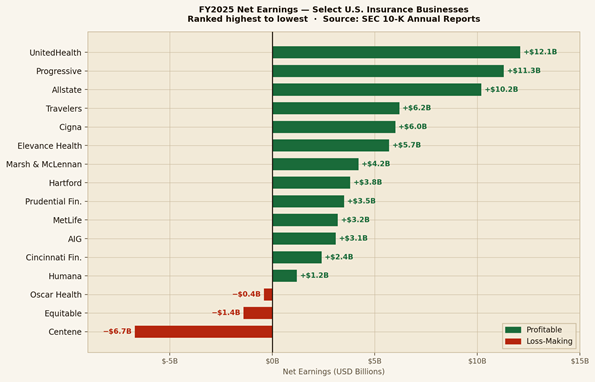
FIGURE 4 - FY2025 Net Earnings: Select US Insurance Businesses
METHODOLOGY & DATA VERIFICATION
EBIT figures represent earnings before interest and taxes as disclosed in annual 10-K filings. Net margins calculated as NetEarnings ÷ Total_Revenue; EBIT margins as EBIT ÷ Total_Revenue. EBIT swings = FY2025 EBIT minus FY2022 EBIT. All figures in USD millions. Not investment advice.