This article was provided by CARFAX Canada
Today’s used vehicle landscape is very volatile. With supply issues causing historically high values, a rise in sophisticated fraud schemes, higher repair costs due to innovative technology, and the emergence of electric vehicles, history data is becoming an increasingly important tool to help insurers manage risk and improve operational efficiency.
Auto insurers manage risk primarily by segmenting customers by age, gender, residence, marital status, and credit score. Categorizing vehicles by year, make, model and type, provides some additional insight, but two similar vehicles will have unique histories which can influence the risk either positively or negatively.
Certain vehicle history data elements have statistically proven correlations that can help carriers to predict risk at underwriting and more accurately determine the value of vehicle at first notice of loss. Some of these valuable vehicle history data points include independently verified annual mileage, prior accident damage, length of ownership, and number of owners.
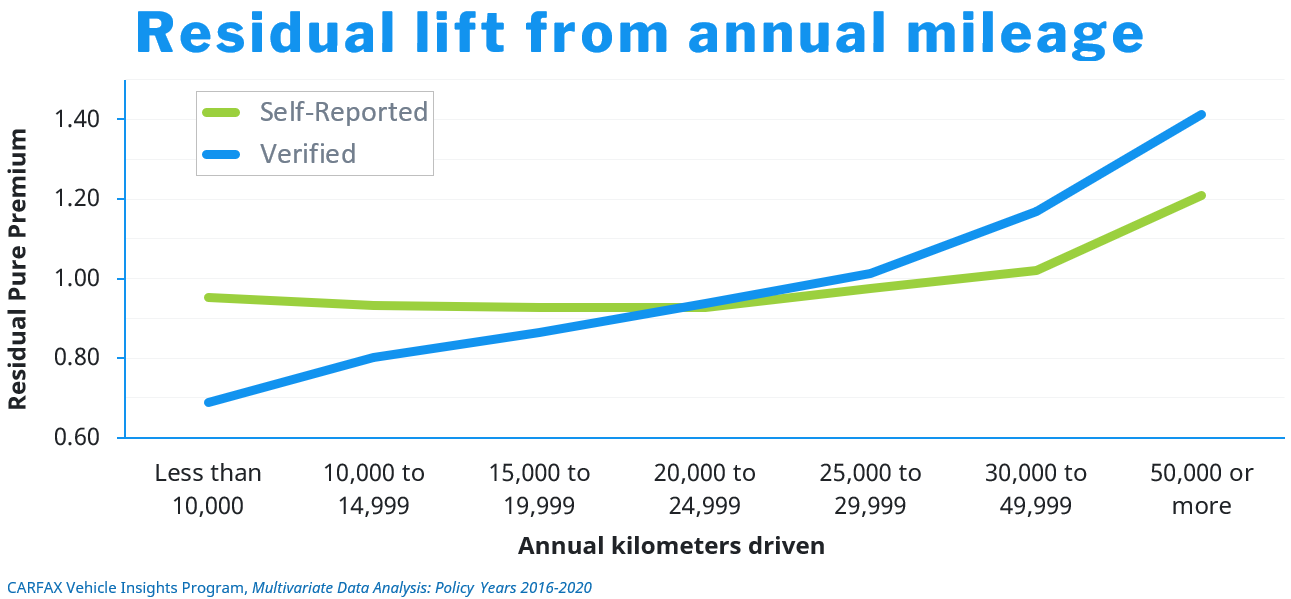
The graph below illustrates the effect of verified mileage on losses, compared to self-reported mileage. There’s a much higher lift with the verified mileage data, demonstrating that it’s a very powerful exposure measure, and insurers should not rely on self-reported data alone. Verified mileage is also more accurate when modelling usage-based pricing.
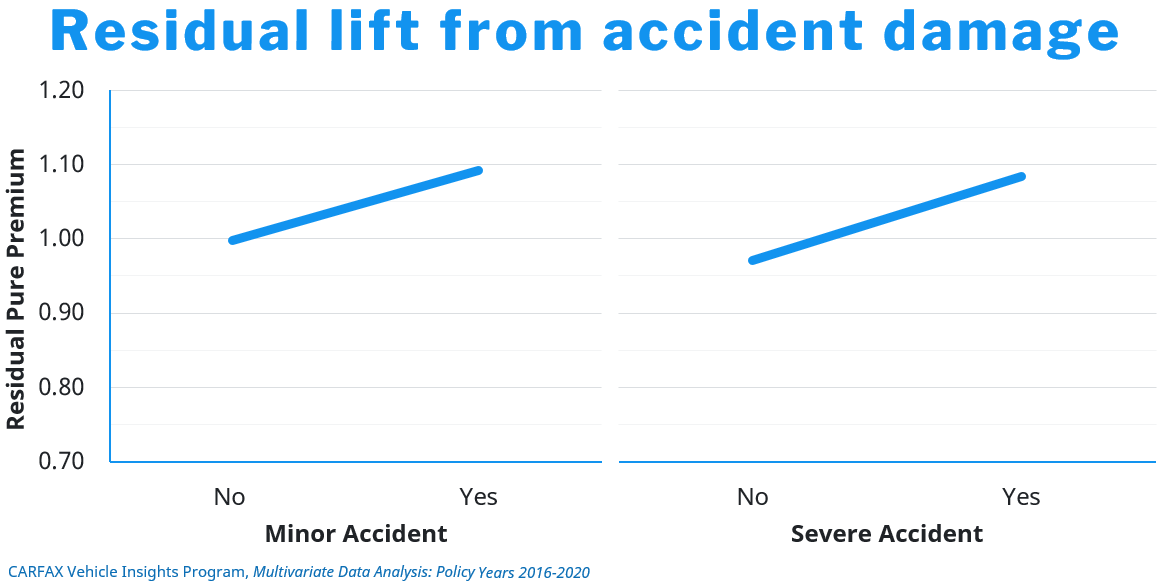
Identifying prior damage can inform the underwriting process, since it correlates to a propensity for greater losses. Aside from the obvious major events such as fire, flood and frame damage, CARFAX studies have shown that even vehicles with only minor accident damage have a higher loss frequency than vehicles with severe accident damage. Also, the more minor damage events a vehicle has, the worse its loss performance and vehicles with five or more minor damage events have loss costs similar to vehicles with severe damage.
The graph below shows the similarity in residual lift when comparing minor accident damage and severe accident damage.
Capturing vehicle history data such as this at the VIN level, and leveraging it in underwriting, or as part of claims triage or total loss workflow, is an emerging trend in Canada. As a starting point, to help an insurer understand how their portfolio compares to the industry average, CARFAX Canada has measured these vehicle history data points for all vehicles in operation (VIO) in Canada. By comparing a sample of their book to this benchmark, they can identify opportunities to mitigate risk and improve efficiency, using data to drive better decision making.
Visit our website to view a sample report, and to request a no-cost custom report for your book of business.
Unless otherwise specified, the stats and information referenced in this article are based on the experience of the CARFAX Banking & Insurance Group in the US and reflect US results only.
Mike Foster is the director of banking and insurance at CARFAX Canada. Mike has 30 years of diverse automotive industry experience working with OEMs, captives, auto finance companies, and insurers. Over the past several years, he has led financial services solution development by advocating on behalf of auto lenders and insurance carriers, aligning CARFAX Canada’s industry leading vehicle history data with their needs.
In the insurance space, Mike and his sales team work with carriers to improve underwriting and claims decision-making and overall business processes. This is done in part by providing proof-of-concept data sampling, customized product and data offerings, implementation, and ongoing support.